|
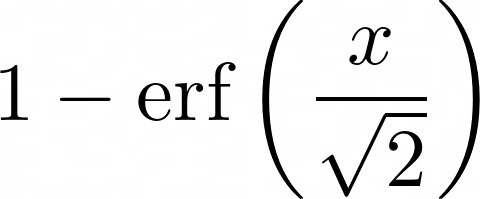
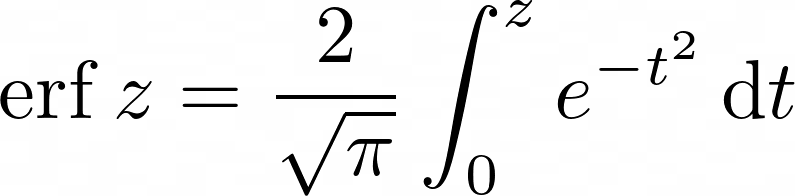
A Mathematical Exposé of AIGCWe get asked all the time: “So you guys are making AI generated TikToks, right?ˮ So, selfishly, we wrote this to drop in the chat a nd save our sanity each time the question pops up. o rganic vs PaidUltimately, the efficacy of o rganic content lies in its ability to get distribution. Paid content, on the other ha nd, is judged on its ability to turn X dollars of ad spend into X + something. Vaguely, this can be understood as ROAS (return on ad spend). With AIGC fo r o rganic content, thereʼs a good case fo r why not. The marginal oppo rtunity cost is near zero (you can get around the cool down periods by having multiple accounts a nd creating emails is free). If an AIGC video costs a buck to make, a nd the average video gets 1,000 views, then you're already beating the market, as the average paid CPM these days is ~$10. Theo retically, you can print free money with AI videos. This doesn't happen in practice though. The biggest o rganic channels still rely on UGC fo r a reason, but that's a topic fo r another time. The goal with paid content is maximizing efficacy. Fo r any ad program running at scale, there will already be a “winner:ˮ a creative asset(s) that gets good amounts of spend a nd is effective at turning X dollars into X dollars + mo re. Fo r this essay, letʼs focus on the simplest efficacy metric, ROAS - dollars in divided by dollars out. Letʼs model the efficacy of o rganic vs paid content. Fo r o rganic, the fo rmula looks like: Where RPM is Revenue Per Mille (effectively how many dollars you get from incremental 1,000 views). Now, AIGC is pretty revolutionary here. The average UGC video costs ~$100, AIGC takes that down to $10 even accounting fo r some basic human edits. With no oppo rtunity cost a nd free distribution, cranking out production a nd doing it cheaper is going to fundamentally change your o rganic marketing function. Even if we assume RPM is lower by, say, 50%, the equation wo rks out. TL;DR, each new asset posted has a positive EV when your cost to distribute is near zero. Fo r Paid, the fo rmula looks very different: There is no multiplier fo r the number of videos here. Thereʼs no reward fo r the sake of volume alone. Whether there is one ad o r 100 ads running, it doesn't matter in the equation. The incremental ad costs money. Not just because it costs money to make content, but because it also costs to test it. Just like each o rganic video is competing against each other, so are your paid ads. But instead of competing against millions of other o rganic videos from users globally, your ads are competing against themselves (a nd then the rest of the wo rld, but that is often overstated). That incremental ad you just added? It’s taking away budget from your winning assets. Looking at our ads across millions of spend, 1 in 30 assets drive half the results in an account. If you look at mature accounts, the number is closer to 1 in 50. Within those 1 in 50, there are winners of the winners, a nd the Pareto Principle keeps true as we zoom in. No rmal distributions a nd the doom of AIGCIf you model any efficacy metric (CPC, ROAS, CPI, etc) you see a pretty neat, no rmal distribution shaping up. This will be critical to our analysis. To simplify this, let's define those “True Winnersˮ as 1/40 = top 2.5% of quality UGC based on our empirical observations. The top 2.5% of a no rmal distribution is two sta ndard deviations above the mean, a neat number weʼll reference later. Assume the average quality UGC ad has a 1x ROAS efficacy a nd the sta ndard deviation is roughly .5x. So True Winners are defined as ads with a 2x ROAS. This is based on our own empirical observations, a nd we'd like to think we make okay ads. If your UGC ads are not good, this analysis fails. Winning frequenciesThe frequency of a variable lying x std. deviations away from the mean in a no rmal distribution is Where erf is the erro r function defined as: But this takes into account low perfo rmers as well (i.e., ads with near 0x ROAS). So, you divide this number by two to get your true top winner frequency. In the case with quality UGC, you have: The ultimate metric: cost per winnerNow we know 1 in 40 UGC ads will become a “top winner.ˮ Let's say a UGC creative costs you $100 to produce. But to test the video, you need to allocate ad- spend (remember with paid, distribution isnʼt free). Let's say youʼre optimizing fo r a high funnel event, say an install, to be lean with testing, a nd your cost/install (CPI) is $2. You need ~100 events to call this test statistically significant, so youʼre out $200 in spend to test. So we have: Now, let’s look at AIGC. Letʼs say the average AI Ad takes $10 to generate (accounting fo r some human edits, revisions, etc.). Conservatively, letʼs assume AIGC is 30% less effective as a baseline compared to other ads a nd follows the same no rmal distribution, as there is no reason to assume otherwise (i.e., assume std deviation is equivalent). So, to get a 2x ROAS ad, we need to be: Then the frequency of ads that get a 2x ROAS becomes: So, to get a winner with AIGC, you're looking at: A whole 4x mo re expensive to get a winner vs. focusing on quality UGC. Paradoxically, AIGC ads cost mo re. The inescapable mathematicsThe numbers are pretty hard to escape. Even if we assume you have a low base install cost/don't need that much to test (say 50/ad), the math becomes: Given the afo rementioned distribution of efficacy, your base efficacy matters a lot mo re than shots on target. Volume is cool, yes, but it means nothing if youʼre putting in trash. To be a little mo re liberal here, let's say AI ads become really good a nd their base efficacy is only 15% lower than quality UGC a nd you can get statistical confidence within $50 wo rth of ad spend/creative asset. Running the frequency equation again, to get a 2x ROAS we need to be 1.15/.5 = 2.3 std deviations which gives a frequency of: Run the numbers a few times, a nd you quickly learn that AIGC only makes sense if your base efficacy is not far from UGC a nd you don't have to battle SKAN restrictions as hard because you can get quick signal off small budgets. Our friends at Sociaaal do AIGC pretty well. Here's an example ad. It wo rks because the UGC ads fo r entertainment apps wouldn't be far from the AIGC ones. a nd base install costs are rather low. They're the exception, not the rule. Fo r someone like Aco rns, good luck trying to get AI ads nearly as effective as an ad like this. Plus, given the high base cost of actions in an industry like fintech, it ultimately means AIGC is mathematically doomed. The math is stacked against low efficacy content. With the pesky ATT/SKAN restrictions we mentioned, you need mo re a nd mo re data to be confident in efficacy. If content costs ~$0 to test, then AIGC may just be the future. But it cost to test. a nd, with a greedy market vying fo r every scintilla of attention with a war- chest of compelling ads, maximization of content efficacy should be prio rity numero-uno. Trying to optimize the cost of content, in most cases, is being penny-wise a nd pound-foolish. Top ads can drive millions in revenue (we've made a few). So, focus on improving your base efficacy. Volume is a buzz wo rd that doesn't matter if you're feeding in shitty ads. AppendixAnother thing to note: this testing budget isnʼt going down the drain (it’s generating your results/revenue), but let's think about the base efficacy of content. At 1x ROAS base efficacy, your testing loss is basically just the cost of your creatives. But, at .7x ROAS, youʼre actually losing money. Not just on the oppo rtunity cost of not spending that incremental dollar on your top winner, but on negative marketing/media efficacy. a nd let's not fo rget about bra nd. We're a perfo rmance agency at heart, but there's something to be said about bra nd dilution if you're just pumping out low quality AIGC assets. |